GPU & CPU Benchmark of Pimax Crystal Light
GPU & CPU Benchmark of Pimax Crystal Light
Curious how Pimax Crystal Light would perform in your favorite game with your current GPU and CPU?
This page provides detailed and trustworthy performance data collected from over 500 real Crystal Light users via an official Pimax survey. All data here is community-driven and reflects actual in-game performance, not lab tests. Just click on a game to explore the data you care about most—see how different GPUs and CPUs perform in terms of resolution scale, average FPS, and user-rated visual quality.
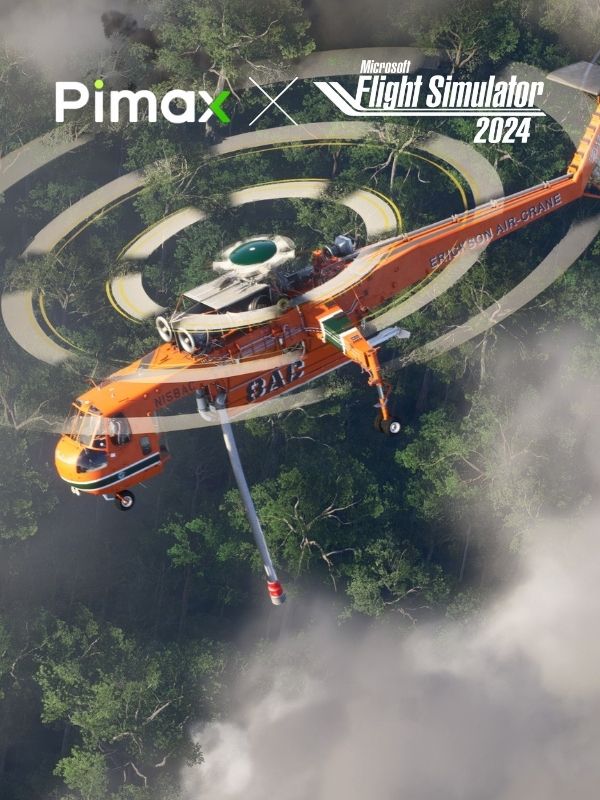
- Microsoft Flight Simulator
- DCS World
- iRacing
- Assetto Corsa
- Automobilista
- Half-Life Alyx
- American Truck Simulator / Euro Truck Simulator
*All data is based on average results from a survey of Crystal Light owners. For hardware with fewer responses, individual settings may significantly affect performance. Results are for reference only.
Want to see performance data for other games?
Fill in this form and let us know! We’ll keep this page continuously updated with new feedback and reports.
Gaming Performance Unveiled
Microsoft Flight Simulator

| Game | GPU | Score | Res Scale | Avg FPS |
|---|---|---|---|---|
| Microsoft Flight Simulator | NVIDIA RTX 5090 | 8.4 | 75%–100% | 60-70 FPS |
| Microsoft Flight Simulator | NVIDIA RTX 5080 | 8.5 | 75%–100% | 70-80 FPS |
| Microsoft Flight Simulator | NVIDIA RTX 5070 Ti | 8.5 | 75%–100% | 40-50 FPS |
| Microsoft Flight Simulator | NVIDIA RTX 5070 | 7.5 | 75%–100% | 70-80 FPS |
| Microsoft Flight Simulator | AMD RX 9070 XT | 8.5 | 50%–75% | 60-70 FPS |
| Microsoft Flight Simulator | AMD RX 9700 XTX | 6.0 | 50%–75% | 40-50 FPS |
| Microsoft Flight Simulator | NVIDIA RTX 5000 | 10.0 | 75%–100% | 70-80 FPS |
| Microsoft Flight Simulator | NVIDIA RTX 4090 | 8.3 | 75%–100% | 50-60 FPS |
| Microsoft Flight Simulator | NVIDIA RTX 4080 Ti | 8.0 | 75%–100% | 80-90 FPS |
| Microsoft Flight Simulator | NVIDIA RTX 4080 Super | 8.6 | 50%–75% | 50-60 FPS |
| Microsoft Flight Simulator | NVIDIA RTX 4080 | 7.9 | 75%–100% | 50-60 FPS |
| Microsoft Flight Simulator | NVIDIA RTX 4080 Laptop | 9.0 | 75%–100% | 40-50 FPS |
| Microsoft Flight Simulator | NVIDIA RTX 4070 Ti Super | 8.3 | 75%–100% | 30-40 FPS |
| Microsoft Flight Simulator | NVIDIA RTX 4070 Super | 8.5 | 25%–50% | 40-50 FPS |
| Microsoft Flight Simulator | NVIDIA RTX 4070 Ti | 8.8 | 50%–75% | 30-40 FPS |
| Microsoft Flight Simulator | NVIDIA RTX 4070 | 7.4 | 50%–75% | 40-50 FPS |
| Microsoft Flight Simulator | NVIDIA RTX 4060 Ti | 7.0 | 75%–100% | 30-40 FPS |
| Microsoft Flight Simulator | AMD RX 7900 XTX | 8.4 | 50%–75% | 60-70 FPS |
| Microsoft Flight Simulator | AMD RX 7800 XT | 8.0 | 75%–100% | 40-50 FPS |
| Microsoft Flight Simulator | NVIDIA RTX 3090 Ti | 8.0 | 75%–100% | 50-60 FPS |
| Microsoft Flight Simulator | NVIDIA RTX 3090 | 8.5 | 50%–75% | 50-60 FPS |
| Microsoft Flight Simulator | NVIDIA RTX 3080 Ti | 7.9 | 50%–75% | 40-50 FPS |
| Microsoft Flight Simulator | NVIDIA RTX 3080 Super | 8.0 | 50%–75% | 40-50 FPS |
| Microsoft Flight Simulator | NVIDIA RTX 3080 | 8.1 | 50%–75% | 50-60 FPS |
| Microsoft Flight Simulator | NVIDIA RTX 3070 Ti | 2.0 | 10%–25% | Below 30 FPS |
| Microsoft Flight Simulator | NVIDIA RTX 3070 | 8.0 | 50%–75% | 40-50 FPS |
| Microsoft Flight Simulator | NVIDIA RTX 3060 Ti | 8.0 | 75%–100% | 50-60 FPS |
| Microsoft Flight Simulator | AMD RX 6800 XT | 7.0 | 75%–100% | Below 30 FPS |
| Microsoft Flight Simulator | AMD RX 6800 | 8.0 | 25%–50% | 40-50 FPS |
| Microsoft Flight Simulator | NVIDIA RTX 2080 Ti | 9.0 | 75%–100% | Below 30 FPS |
| Microsoft Flight Simulator | NVIDIA RTX 2080 Super | 4.0 | 10%–25% | Below 30 FPS |
| Game | CPU | Score | Res Scale | Avg FPS |
|---|---|---|---|---|
| Microsoft Flight Simulator | AMD 9950X3D | 8.6 | 75%–100% | 60-70 FPS |
| Microsoft Flight Simulator | AMD 9800X3D | 8.7 | 75%–100% | 60-70 FPS |
| Microsoft Flight Simulator | AMD 9950X | 7.4 | 50%–75% | 50-60 FPS |
| Microsoft Flight Simulator | AMD 9950 | 7.0 | 50%–75% | 60-70 FPS |
| Microsoft Flight Simulator | Intel i9-14900KS | 5.5 | 50%–75% | 40-50 FPS |
| Microsoft Flight Simulator | Intel i9-14900KF | 9.0 | 50%–75% | 50-60 FPS |
| Microsoft Flight Simulator | Intel i9-14900K | 7.8 | 75%–100% | 50-60 FPS |
| Microsoft Flight Simulator | Intel i9-14900 | 6.3 | 50%–75% | 40-50 FPS |
| Microsoft Flight Simulator | Intel i7-14700KS | 10.0 | 75%–100% | 50-60 FPS |
| Microsoft Flight Simulator | Intel i7-14700KF | 7.0 | 75%–100% | 40-50 FPS |
| Microsoft Flight Simulator | Intel i7-14700K | 9.0 | 75%–100% | 60-70 FPS |
| Microsoft Flight Simulator | Intel i5-14600K | 8.0 | 75%–100% | 40-50 FPS |
| Microsoft Flight Simulator | AMD 7900X3D | 7.5 | 50%–75% | 30-40 FPS |
| Microsoft Flight Simulator | AMD 7800X3D | 8.3 | 75%–100% | 40-50 FPS |
| Microsoft Flight Simulator | AMD 9700X | 10.0 | 75%–100% | 30-40 FPS |
| Microsoft Flight Simulator | AMD 9600X | 6.0 | 10%–25% | 30-40 FPS |
| Microsoft Flight Simulator | AMD 9600KF | 8.0 | 75%–100% | 30-40 FPS |
| Microsoft Flight Simulator | AMD 7950X3D | 9.0 | 50%–75% | 60-70 FPS |
| Microsoft Flight Simulator | AMD 7950X | 8.0 | 75%–100% | 50-60 FPS |
| Microsoft Flight Simulator | Intel i9-13900KF | 8.5 | 75%–100% | 40-50 FPS |
| Microsoft Flight Simulator | Intel i9-13900K | 8.9 | 75%–100% | 50-60 FPS |
| Microsoft Flight Simulator | Intel i9-13900 | 8.5 | 75%–100% | 60-70 FPS |
| Microsoft Flight Simulator | Intel i7-13700KF | 9.0 | 75%–100% | 50-60 FPS |
| Microsoft Flight Simulator | Intel i7-13700K | 8.7 | 50%–75% | 60-70 FPS |
| Microsoft Flight Simulator | Intel i7-13700 | 8.5 | 75%–100% | 60-70 FPS |
| Microsoft Flight Simulator | Intel i5-13600K | 8.5 | 50%–75% | 30-40 FPS |
| Microsoft Flight Simulator | Intel i5-13500 | 6.0 | 10%–25% | Above 90 FPS |
| Microsoft Flight Simulator | Intel 285 | 9.0 | 75%–100% | 70-80 FPS |
| Microsoft Flight Simulator | Intel 285K | 8.5 | 50%–75% | 50-60 FPS |
| Microsoft Flight Simulator | AMD 5800X3D | 8.3 | 50%–75% | 60-70 FPS |
| Microsoft Flight Simulator | AMD 5800X | 8.2 | 50%–75% | 40-50 FPS |
| Microsoft Flight Simulator | Intel i9-12900KS | 7.0 | 75%–100% | 40-50 FPS |
| Microsoft Flight Simulator | Intel i9-12900KF | 8.0 | 75%–100% | 50-60 FPS |
| Microsoft Flight Simulator | Intel i9-12900K | 8.0 | 75%–100% | 50-60 FPS |
| Microsoft Flight Simulator | Intel i7-12700K | 8.0 | 10%–25% | Above 90 FPS |
| Microsoft Flight Simulator | Intel i7-12700 | 8.0 | 75%–100% | 40-50 FPS |
| Microsoft Flight Simulator | Intel i5-12600K | 6.0 | 75%–100% | 30-40 FPS |
| Microsoft Flight Simulator | Intel i5-12600 | 8.0 | 75%–100% | 50-60 FPS |
| Microsoft Flight Simulator | AMD 5950x | 8.7 | 75%–100% | 40-50 FPS |
| Microsoft Flight Simulator | AMD 5900X | 8.1 | 50%–75% | 50-60 FPS |
| Microsoft Flight Simulator | AMD 5600X | 9.0 | 75%–100% | 80-90 FPS |
| Microsoft Flight Simulator | Intel i9-10850K | 7.0 | 75%–100% | 30-40 FPS |
| Microsoft Flight Simulator | Intel i9-9900KF | 9.0 | 75%–100% | Below 30 FPS |
| Microsoft Flight Simulator | Intel i9-9900K | 8.0 | 75%–100% | 60-70 FPS |
| Microsoft Flight Simulator | Intel i9-9900 | 4.0 | 10%–25% | Below 30 FPS |
| Microsoft Flight Simulator | Intel i7-9700K | 8.0 | 75%–100% | 80-90 FPS |
| Microsoft Flight Simulator | Intel i7-9700 | 7.0 | 25%–50% | 30-40 FPS |
| Microsoft Flight Simulator | AMD 3700X | 9.0 | 50%–75% | 40-50 FPS |
| Microsoft Flight Simulator | AMD 9800 | 9.0 | 75%–100% | 80-90 FPS |
| Microsoft Flight Simulator | AMD 7800 | 8.0 | 75%–100% | 30-40 FPS |
| Microsoft Flight Simulator | AMD 7700 | 10.0 | 75%–100% | 30-40 FPS |
DCS World

| Game | GPU | Score | Res Scale | Avg FPS |
|---|---|---|---|---|
| DCS World | NVIDIA RTX 5090 | 8.2 | 75%–100% | 70-80 FPS |
| DCS World | NVIDIA RTX 5080 | 8.9 | 75%–100% | 70-80 FPS |
| DCS World | NVIDIA RTX 5070 Ti | 8.0 | 75%–100% | 60-70 FPS |
| DCS World | NVIDIA RTX 5070 | 8.0 | 75%–100% | 80-90 FPS |
| DCS World | AMD RX 9070 XT | 8.0 | 75%–100% | 50-60 FPS |
| DCS World | NVIDIA RTX 4090 | 8.3 | 75%–100% | 60-70 FPS |
| DCS World | NVIDIA RTX 4080 Ti | 8.0 | 75%–100% | 70-80 FPS |
| DCS World | NVIDIA RTX 4080 Super | 8.4 | 75%–100% | 60-70 FPS |
| DCS World | NVIDIA RTX 4080 | 8.9 | 75%–100% | 60-70 FPS |
| DCS World | NVIDIA RTX 4080 Laptop | 8.5 | 50%–75% | 50-60 FPS |
| DCS World | NVIDIA RTX 4070 Ti Super | 8.7 | 75%–100% | 50-60 FPS |
| DCS World | NVIDIA RTX 4070 Ti | 9.0 | 50%–75% | 50-60 FPS |
| DCS World | NVIDIA RTX 4070 | 7.3 | 50%–75% | 40-50 FPS |
| DCS World | NVIDIA RTX 4060 Ti | 8.0 | 75%–100% | 30-40 FPS |
| DCS World | AMD RX 7900 XTX | 8.5 | 50%–75% | 60-70 FPS |
| DCS World | AMD RX 7800 XT | 9.0 | 75%–100% | 50-60 FPS |
| DCS World | NVIDIA RTX 3090 Ti | 8.7 | 50%–75% | 50-60 FPS |
| DCS World | NVIDIA RTX 3090 | 8.5 | 50%–75% | 50-60 FPS |
| DCS World | NVIDIA RTX 3080 Ti | 8.3 | 50%–75% | 40-50 FPS |
| DCS World | NVIDIA RTX 3080 Super | 8.0 | 50%–75% | 40-50 FPS |
| DCS World | NVIDIA RTX 3080 | 8.2 | 75%–100% | 70-80 FPS |
| DCS World | NVIDIA RTX 3070 Ti | 7.0 | 75%–100% | 40-50 FPS |
| DCS World | NVIDIA RTX 3070 | 7.0 | 50%–75% | 40-50 FPS |
| DCS World | NVIDIA RTX 3060 Ti | 8.0 | 75%–100% | 50-60 FPS |
| DCS World | AMD RX 6800 XT | 7.0 | 75%–100% | Below 30 FPS |
| DCS World | AMD RX 6800 | 8.0 | 25%–50% | 40-50 FPS |
| DCS World | AMD RX 6700 XT | 8.0 | 75%–100% | 40-50 FPS |
| DCS World | NVIDIA RTX 2080 Ti | 9.5 | 75%–100% | Below 30 FPS |
| DCS World | NVIDIA RTX 2080 Super | 4.0 | 10%–25% | Below 30 FPS |
| DCS World | NVIDIA RTX 2080 | 7.0 | 75%–100% | 50-60 FPS |
| DCS World | AMD RX 5900 | 10.0 | 75%–100% | 80-90 FPS |
| Game | CPU | Score | Res Scale | Avg FPS |
|---|---|---|---|---|
| DCS World | AMD 9950X3D | 7.6 | 75%–100% | 60-70 FPS |
| DCS World | AMD 9800X3D | 8.9 | 75%–100% | 60-70 FPS |
| DCS World | AMD 9950X | 7.5 | 50%–75% | 50-60 FPS |
| DCS World | AMD 9950 | 7.0 | 50%–75% | 60-70 FPS |
| DCS World | Intel i9-14900KS | 7.0 | 75%–100% | 70-80 FPS |
| DCS World | Intel i9-14900KF | 10.0 | 50%–75% | 50-60 FPS |
| DCS World | Intel i9-14900K | 7.7 | 75%–100% | 50-60 FPS |
| DCS World | Intel i9-14900 | 7.2 | 50%–75% | 50-60 FPS |
| DCS World | Intel i7-14700KS | 10.0 | 75%–100% | 50-60 FPS |
| DCS World | Intel i7-14700KF | 7.5 | 50%–75% | 70-80 FPS |
| DCS World | Intel i7-14700K | 8.0 | 75%–100% | 50-60 FPS |
| DCS World | Intel i7-14700 | 8.0 | 75%–100% | 60-70 FPS |
| DCS World | Intel i5-14600K | 8.0 | 75%–100% | 40-50 FPS |
| DCS World | AMD 7950X3D | 8.7 | 75%–100% | 50-60 FPS |
| DCS World | AMD 7900X3D | 8.5 | 50%–75% | 50-60 FPS |
| DCS World | AMD 7800X3D | 8.5 | 75%–100% | 50-60 FPS |
| DCS World | AMD 7700X | 8.5 | 75%–100% | 40-50 FPS |
| DCS World | AMD 7600 | 9.0 | 75%–100% | 70-80 FPS |
| DCS World | AMD 5600X3D | 8.0 | 50%–75% | 70-80 FPS |
| DCS World | Intel i9-13900KS | 8.0 | 75%–100% | 70-80 FPS |
| DCS World | Intel i9-13900KF | 8.3 | 75%–100% | 70-80 FPS |
| DCS World | Intel i9-13900K | 8.5 | 75%–100% | 70-80 FPS |
| DCS World | Intel i9-13900 | 8.3 | 50%–75% | 60-70 FPS |
| DCS World | Intel i7-13700KF | 8.7 | 75%–100% | 60-70 FPS |
| DCS World | Intel i7-13700K | 8.5 | 75%–100% | 70-80 FPS |
| DCS World | Intel i7-13700 | 8.5 | 75%–100% | 60-70 FPS |
| DCS World | Intel i5-13600K | 9.0 | 50%–75% | 40-50 FPS |
| DCS World | Intel i5-13500 | 6.0 | 10%–25% | Above 90 FPS |
| DCS World | Intel 285 | 9.0 | 75%–100% | 70-80 FPS |
| DCS World | AMD 7950X | 9.3 | 75%–100% | 60-70 FPS |
| DCS World | AMD 7900X | 9.0 | 75%–100% | 70-80 FPS |
| DCS World | AMD 5800X3D | 8.5 | 50%–75% | 50-60 FPS |
| DCS World | AMD 5800X | 8.3 | 50%–75% | 40-50 FPS |
| DCS World | Intel i9-12900KF | 8.0 | 75%–100% | 50-60 FPS |
| DCS World | Intel i9-12900K | 8.4 | 50%–75% | 60-70 FPS |
| DCS World | Intel i7-12700KF | 9.0 | 75%–100% | 50-60 FPS |
| DCS World | Intel i7-12700K | 8.0 | 10%–25% | Above 90 FPS |
| DCS World | Intel i5-12600 | 8.0 | 75%–100% | 50-60 FPS |
| DCS World | AMD 5950x | 9.0 | 50%–75% | 50-60 FPS |
| DCS World | AMD 5950 | 10.0 | 75%–100% | 60-70 FPS |
| DCS World | AMD 5900X | 7.8 | 50%–75% | 60-70 FPS |
| DCS World | AMD 5600X | 10.0 | 75%–100% | 70-80 FPS |
| DCS World | Intel i9-11900K | 8.3 | 75%–100% | 60-70 FPS |
| DCS World | Intel i9-10900K | 9.5 | 75%–100% | 60-70 FPS |
| DCS World | Intel i9-10850K | 3.0 | 50%–75% | 80-90 FPS |
| DCS World | Intel i9-9900KF | 9.5 | 75%–100% | 30-40 FPS |
| DCS World | Intel i7-9700K | 8.0 | 75%–100% | 80-90 FPS |
| DCS World | AMD 4800X | 7.0 | 75%–100% | 50-60 FPS |
| DCS World | AMD 9800 | 9.0 | 75%–100% | 70-80 FPS |
| DCS World | AMD 7700K | 9.0 | 75%–100% | 50-60 FPS |
Assetto Corsa

| Game | GPU | Score | Res Scale | Avg FPS |
|---|---|---|---|---|
| Assetto Corsa | NVIDIA RTX 5090 | 8.6 | 75%–100% | 80-90 FPS |
| Assetto Corsa | NVIDIA RTX 5080 | 8.2 | 75%–100% | 80-90 FPS |
| Assetto Corsa | NVIDIA RTX 5070 Ti | 9.5 | 75%–100% | 50-60 FPS |
| Assetto Corsa | NVIDIA RTX 5070 | 9.0 | 10%–25% | 80-90 FPS |
| Assetto Corsa | NVIDIA RTX 5060 Ti | 9.0 | 50%–75% | 50-60 FPS |
| Assetto Corsa | AMD RX 9070 XT | 10.0 | 75%–100% | 50-60 FPS |
| Assetto Corsa | AMD RX 9700 XTX | 6.0 | 50%–75% | 40-50 FPS |
| Assetto Corsa | NVIDIA RTX 4090 | 8.5 | 75%–100% | 70-80 FPS |
| Assetto Corsa | NVIDIA RTX 4080 Ti | 8.0 | 75%–100% | 80-90 FPS |
| Assetto Corsa | NVIDIA RTX 4080 Super | 9.0 | 75%–100% | 60-70 FPS |
| Assetto Corsa | NVIDIA RTX 4080 | 7.4 | 75%–100% | 80-90 FPS |
| Assetto Corsa | NVIDIA RTX 4070 Ti Super | 8.0 | 75%–100% | 40-50 FPS |
| Assetto Corsa | NVIDIA RTX 4070 Ti | 8.7 | 50%–75% | 80-90 FPS |
| Assetto Corsa | NVIDIA RTX 4070 Super | 9.0 | 25%–50% | 40-50 FPS |
| Assetto Corsa | NVIDIA RTX 4070 | 9.7 | 50%–75% | 60-70 FPS |
| Assetto Corsa | AMD RX 7900 XTX | 8.3 | 75%–100% | 80-90 FPS |
| Assetto Corsa | AMD RX 7900 XT | 8.0 | 75%–100% | 80-90 FPS |
| Assetto Corsa | AMD RX 7800 XT | 8.6 | 75%–100% | 70-80 FPS |
| Assetto Corsa | NVIDIA RTX 3090 Ti | 8.0 | 75%–100% | Above 90 FPS |
| Assetto Corsa | NVIDIA RTX 3090 | 9.3 | 50%–75% | 60-70 FPS |
| Assetto Corsa | NVIDIA RTX 3080 Ti | 8.3 | 75%–100% | 60-70 FPS |
| Assetto Corsa | NVIDIA RTX 3080 | 8.6 | 75%–100% | 60-70 FPS |
| Assetto Corsa | NVIDIA RTX 3060 Ti | 8.0 | 75%–100% | 50-60 FPS |
| Assetto Corsa | AMD RX 6900 XT | 8.0 | 75%–100% | 60-70 FPS |
| Assetto Corsa | NVIDIA RTX 2070 Super | 8.0 | 25%–50% | 80-90 FPS |
| Game | CPU | Score | Res Scale | Avg FPS |
|---|---|---|---|---|
| Assetto Corsa | AMD 9950X3D | 9.5 | 75%–100% | 80-90 FPS |
| Assetto Corsa | AMD 9800X3D | 8.6 | 50%–75% | 70-80 FPS |
| Assetto Corsa | AMD 9700X | 10.0 | 75%–100% | 30-40 FPS |
| Assetto Corsa | Intel i9-14900KS | 7.0 | 75%–100% | 70-80 FPS |
| Assetto Corsa | Intel i9-14900KF | 9.3 | 75%–100% | 60-70 FPS |
| Assetto Corsa | Intel i9-14900K | 8.7 | 75%–100% | 50-60 FPS |
| Assetto Corsa | Intel i9-14900 | 9.0 | 75%–100% | 40-50 FPS |
| Assetto Corsa | Intel i5-14600K | 9.0 | 50%–75% | 60-70 FPS |
| Assetto Corsa | AMD 7950X3D | 8.5 | 50%–75% | 60-70 FPS |
| Assetto Corsa | AMD 7900 | 9.5 | 75%–100% | 70-80 FPS |
| Assetto Corsa | AMD 7800X3D | 8.6 | 75%–100% | 80-90 FPS |
| Assetto Corsa | AMD 7700K | 9.0 | 75%–100% | 50-60 FPS |
| Assetto Corsa | AMD 7600X | 7.0 | 75%–100% | 60-70 FPS |
| Assetto Corsa | Intel 285K | 6.0 | 10%–25% | 60-70 FPS |
| Assetto Corsa | Intel i9-13900KS | 8.0 | 75%–100% | 70-80 FPS |
| Assetto Corsa | Intel i9-13900KF | 9.0 | 50%–75% | 80-90 FPS |
| Assetto Corsa | Intel i9-13900K | 10.0 | 75%–100% | 70-80 FPS |
| Assetto Corsa | Intel i9-13900 | 9.0 | 75%–100% | 70-80 FPS |
| Assetto Corsa | Intel i7-14700KF | 7.5 | 50%–75% | 70-80 FPS |
| Assetto Corsa | Intel i7-13700KF | 9.0 | 75%–100% | 60-70 FPS |
| Assetto Corsa | Intel i7-13700K | 8.0 | 50%–75% | 80-90 FPS |
| Assetto Corsa | Intel i5-13600K | 8.3 | 75%–100% | 60-70 FPS |
| Assetto Corsa | AMD 5950x | 9.0 | 75%–100% | 50-60 FPS |
| Assetto Corsa | AMD 5900X | 8.7 | 75%–100% | 80-90 FPS |
| Assetto Corsa | AMD 5800X3D | 8.2 | 75%–100% | 70-80 FPS |
| Assetto Corsa | AMD 5800X | 10.0 | 75%–100% | 70-80 FPS |
| Assetto Corsa | AMD 5600X | 8.3 | 50%–75% | 80-90 FPS |
| Assetto Corsa | Intel i9-12900K | 9.0 | 75%–100% | 80-90 FPS |
| Assetto Corsa | Intel i9-11900K | 10.0 | 75%–100% | 80-90 FPS |
| Assetto Corsa | Intel i9-10900K | 8.0 | 25%–50% | 80-90 FPS |
| Assetto Corsa | Intel i9-9900K | 8.5 | 50%–75% | 50-60 FPS |
| Assetto Corsa | Intel i7-12700K | 10.0 | 50%–75% | 80-90 FPS |
| Assetto Corsa | Intel i7-12700 | 8.5 | 50%–75% | 40-50 FPS |
| Assetto Corsa | Intel i7-11700 | 8.0 | 75%–100% | 50-60 FPS |
| Assetto Corsa | Intel i7-9700K | 8.0 | 75%–100% | 80-90 FPS |
| Assetto Corsa | Intel i5-11600K | 8.0 | 75%–100% | 70-80 FPS |
| Assetto Corsa | AMD 9800 | 9.0 | 75%–100% | 70-80 FPS |
Half-Life Alyx

| Game | GPU | Score | Res Scale | Avg FPS |
|---|---|---|---|---|
| Half-Life Alyx | NVIDIA RTX 5090 | 8.9 | 75%–100% | 80-90 FPS |
| Half-Life Alyx | NVIDIA RTX 5080 | 8.7 | 75%–100% | 80-90 FPS |
| Half-Life Alyx | NVIDIA RTX 5070 Ti | 8.5 | 75%–100% | 60-70 FPS |
| Half-Life Alyx | NVIDIA RTX 5070 | 8.0 | 75%–100% | 80-90 FPS |
| Half-Life Alyx | NVIDIA RTX 5060 Ti | 9.0 | 50%–75% | 50-60 FPS |
| Half-Life Alyx | AMD RX 9070 XT | 8.7 | 75%–100% | 40-50 FPS |
| Half-Life Alyx | NVIDIA RTX 4090 | 8.8 | 75%–100% | 70-80 FPS |
| Half-Life Alyx | NVIDIA RTX 4080 Super | 9.0 | 75%–100% | 60-70 FPS |
| Half-Life Alyx | NVIDIA RTX 4080 | 9.0 | 50%–75% | 50-60 FPS |
| Half-Life Alyx | NVIDIA RTX 4070 Ti Super | 8.0 | 75%–100% | 70-80 FPS |
| Half-Life Alyx | NVIDIA RTX 4070 Super | 9.0 | 25%–50% | 40-50 FPS |
| Half-Life Alyx | NVIDIA RTX 4070 Ti | 8.8 | 50%–75% | 60-70 FPS |
| Half-Life Alyx | NVIDIA RTX 4070 | 8.0 | 50%–75% | 50-60 FPS |
| Half-Life Alyx | NVIDIA RTX 4060 Ti | 7.0 | 75%–100% | 30-40 FPS |
| Half-Life Alyx | AMD RX 7900 XTX | 8.7 | 50%–75% | 60-70 FPS |
| Half-Life Alyx | AMD RX 7900 GRE | 7.0 | 75%–100% | 80-90 FPS |
| Half-Life Alyx | AMD RX 7800 XT | 8.7 | 75%–100% | 80-90 FPS |
| Half-Life Alyx | NVIDIA RTX 3090 | 9.0 | 50%–75% | 60-70 FPS |
| Half-Life Alyx | NVIDIA RTX 3080 Ti | 7.7 | 25%–50% | 50-60 FPS |
| Half-Life Alyx | NVIDIA RTX 3080 | 8.4 | 75%–100% | 70-80 FPS |
| Half-Life Alyx | NVIDIA RTX 3070 | 8.0 | 50%–75% | 40-50 FPS |
| Half-Life Alyx | NVIDIA RTX 2070 Super | 8.0 | 25%–50% | 80-90 FPS |
| Game | CPU | Score | Res Scale | Avg FPS |
|---|---|---|---|---|
| Half-Life Alyx | AMD 9950X3D | 9.0 | 75%–100% | 50-60 FPS |
| Half-Life Alyx | AMD 9800X3D | 8.7 | 75%–100% | 70-80 FPS |
| Half-Life Alyx | AMD 9950X | 8.0 | 75%–100% | 50-60 FPS |
| Half-Life Alyx | Intel i9-14900KF | 10.0 | 50%–75% | 50-60 FPS |
| Half-Life Alyx | Intel i9-14900K | 9.0 | 75%–100% | 60-70 FPS |
| Half-Life Alyx | Intel i9-14900 | 9.5 | 75%–100% | 60-70 FPS |
| Half-Life Alyx | Intel i7-14700KF | 8.0 | 50%–75% | 80-90 FPS |
| Half-Life Alyx | Intel i7-14700K | 8.0 | 75%–100% | 50-60 FPS |
| Half-Life Alyx | Intel i7-14700 | 8.0 | 75%–100% | 60-70 FPS |
| Half-Life Alyx | AMD 7900X3D | 9.0 | 50%–75% | 40-50 FPS |
| Half-Life Alyx | AMD 7900 | 9.0 | 75%–100% | 60-70 FPS |
| Half-Life Alyx | AMD 7800X3D | 8.9 | 75%–100% | 70-80 FPS |
| Half-Life Alyx | AMD 7700 | 10.0 | 75%–100% | 30-40 FPS |
| Half-Life Alyx | AMD 5600X3D | 8.0 | 50%–75% | 70-80 FPS |
| Half-Life Alyx | Intel i9-13900KF | 8.0 | 50%–75% | 70-80 FPS |
| Half-Life Alyx | Intel i9-13900K | 9.3 | 75%–100% | 70-80 FPS |
| Half-Life Alyx | Intel i7-13700KF | 8.0 | 75%–100% | 80-90 FPS |
| Half-Life Alyx | Intel i7-13700K | 8.7 | 50%–75% | 60-70 FPS |
| Half-Life Alyx | Intel i7-13700 | 7.0 | 75%–100% | 30-40 FPS |
| Half-Life Alyx | Intel i5-13600K | 9.0 | 50%–75% | 40-50 FPS |
| Half-Life Alyx | AMD 7950X | 8.0 | 75%–100% | 60-70 FPS |
| Half-Life Alyx | AMD 5950x | 9.0 | 75%–100% | 60-70 FPS |
| Half-Life Alyx | AMD 5900X | 8.6 | 50%–75% | 70-80 FPS |
| Half-Life Alyx | AMD 5800X3D | 8.3 | 75%–100% | 70-80 FPS |
| Half-Life Alyx | AMD 5800X | 10.0 | 75%–100% | 70-80 FPS |
| Half-Life Alyx | AMD 5600X | 8.5 | 50%–75% | 70-80 FPS |
| Half-Life Alyx | Intel i9-11900K | 10.0 | 75%–100% | 80-90 FPS |
| Half-Life Alyx | Intel i9-10900K | 8.0 | 25%–50% | 80-90 FPS |
| Half-Life Alyx | Intel i9-9900K | 9.0 | 50%–75% | 50-60 FPS |
| Half-Life Alyx | Intel i9-9900 | 9.0 | 75%–100% | Above 90 FPS |
| Half-Life Alyx | Intel i7-12700K | 8.7 | 50%–75% | 80-90 FPS |
| Half-Life Alyx | Intel i7-10700K | 9.0 | 75%–100% | Above 90 FPS |
| Half-Life Alyx | Intel i7-9700K | 8.0 | 75%–100% | 80-90 FPS |
iRacing

| Game | GPU | Score | Res Scale | Avg FPS |
|---|---|---|---|---|
| iRacing | NVIDIA RTX 5090 | 8.8 | 75%–100% | Above 90 FPS |
| iRacing | NVIDIA RTX 5080 | 8.2 | 75%–100% | 80-90 FPS |
| iRacing | NVIDIA RTX 5070 Ti | 9.0 | 75%–100% | 80-90 FPS |
| iRacing | NVIDIA RTX 5070 | 8.0 | 75%–100% | 80-90 FPS |
| iRacing | NVIDIA RTX 4090 | 8.7 | 75%–100% | 80-90 FPS |
| iRacing | NVIDIA RTX 4080 Ti | 8.0 | 75%–100% | 80-90 FPS |
| iRacing | NVIDIA RTX 4080 Super | 7.8 | 50%–75% | 80-90 FPS |
| iRacing | NVIDIA RTX 4080 | 9.2 | 50%–75% | 80-90 FPS |
| iRacing | NVIDIA RTX 4070 Ti | 5.0 | 50%–75% | 40-50 FPS |
| iRacing | NVIDIA RTX 4070 | 9.0 | 50%–75% | 80-90 FPS |
| iRacing | NVIDIA RTX 4060 Super | 6.0 | 50%–75% | 80-90 FPS |
| iRacing | AMD RX 7900 XTX | 8.3 | 50%–75% | 80-90 FPS |
| iRacing | AMD RX 7900 XT | 10.0 | 25%–50% | 40-50 FPS |
| iRacing | AMD RX 7900 GRE | 7.0 | 75%–100% | 80-90 FPS |
| iRacing | AMD RX 7800 XT | 7.0 | 75%–100% | Above 90 FPS |
| iRacing | AMD RX 6950 XT | 8.0 | 75%–100% | Above 90 FPS |
| iRacing | NVIDIA RTX 3090 Ti | 10.0 | Below 10% | Above 90 FPS |
| iRacing | NVIDIA RTX 3090 | 8.5 | 50%–75% | 80-90 FPS |
| iRacing | NVIDIA RTX 3080 Ti | 8.3 | 75%–100% | 60-70 FPS |
| iRacing | NVIDIA RTX 3080 | 7.7 | 50%–75% | 80-90 FPS |
| iRacing | NVIDIA RTX 3070 | 3.0 | 25%–50% | Above 90 FPS |
| iRacing | NVIDIA RTX 2080 Ti | 10.0 | 75%–100% | 30-40 FPS |
| iRacing | NVIDIA RTX 2080 Super | 4.0 | 25%–50% | 80-90 FPS |
| Game | CPU | Score | Res Scale | Avg FPS |
|---|---|---|---|---|
| iRacing | AMD 9950X3D | 9.0 | 75%–100% | Above 90 FPS |
| iRacing | AMD 9800X3D | 8.6 | 75%–100% | 80-90 FPS |
| iRacing | AMD 9700 | 8.0 | 75%–100% | Above 90 FPS |
| iRacing | Intel i9-14900KF | 8.5 | 75%–100% | 80-90 FPS |
| iRacing | Intel i9-14900K | 7.0 | 75%–100% | 60-70 FPS |
| iRacing | Intel i5-14600KF | 10.0 | Below 10% | Above 90 FPS |
| iRacing | Intel 285K | 7.0 | 75%–100% | Above 90 FPS |
| iRacing | Intel i7-14700KF | 8.5 | 75%–100% | 70-80 FPS |
| iRacing | AMD 7950X3D | 8.7 | 50%–75% | 80-90 FPS |
| iRacing | AMD 7950 | 8.0 | 75%–100% | 80-90 FPS |
| iRacing | AMD 7900 | 9.0 | 75%–100% | 60-70 FPS |
| iRacing | AMD 7800X3D | 8.6 | 75%–100% | 80-90 FPS |
| iRacing | AMD 7600X | 7.0 | 75%–100% | 60-70 FPS |
| iRacing | AMD 5600X3D | 8.0 | 50%–75% | 70-80 FPS |
| iRacing | Intel i9-13900KS | 7.5 | 25%–50% | 80-90 FPS |
| iRacing | Intel i9-13900KF | 10.0 | 75%–100% | 80-90 FPS |
| iRacing | Intel i7-13700KF | 8.0 | 50%–75% | Above 90 FPS |
| iRacing | Intel i7-13700K | 9.0 | 75%–100% | 80-90 FPS |
| iRacing | Intel i7-13700 | 6.0 | 25%–50% | 80-90 FPS |
| iRacing | Intel i5-13600K | 8.0 | 75%–100% | 60-70 FPS |
| iRacing | AMD 5950x | 8.0 | 75%–100% | Above 90 FPS |
| iRacing | AMD 5900X | 6.7 | 50%–75% | 60-70 FPS |
| iRacing | AMD 5800X3D | 8.3 | 50%–75% | 70-80 FPS |
| iRacing | AMD 5800 | 7.0 | 75%–100% | 80-90 FPS |
| iRacing | AMD 5600X | 9.0 | 75%–100% | Above 90 FPS |
| iRacing | Intel i9-12900K | 7.0 | 75%–100% | 70-80 FPS |
| iRacing | Intel i9-12900 | 10.0 | 75%–100% | 70-80 FPS |
| iRacing | Intel i9-9900X3D | 9.0 | 75%–100% | Above 90 FPS |
| iRacing | Intel i9-9900KS | 4.0 | 25%–50% | 80-90 FPS |
| iRacing | Intel i9-9900K | 6.0 | 50%–75% | 40-50 FPS |
| iRacing | Intel i9-9900 | 9.0 | 75%–100% | Above 90 FPS |
| iRacing | Intel i9-10900K | 10.0 | 50%–75% | Above 90 FPS |
| iRacing | Intel i9-10850K | 3.0 | 50%–75% | 80-90 FPS |
| iRacing | Intel i7-12700K | 9.5 | 50%–75% | 80-90 FPS |
| iRacing | Intel i7-10700K | 7.0 | 50%–75% | 70-80 FPS |
Automobilista

| Game | GPU | Score | Res Scale | Avg FPS |
|---|---|---|---|---|
| Automobilista | NVIDIA RTX 5090 | 8.5 | 75%–100% | 80-90 FPS |
| Automobilista | NVIDIA RTX 5080 | 9.3 | 75%–100% | 70-80 FPS |
| Automobilista | NVIDIA RTX 5070 Ti | 9 | 10%–25% | 80-90 FPS |
| Automobilista | NVIDIA RTX 4090 | 8.5 | 75%–100% | 70-80 FPS |
| Automobilista | NVIDIA RTX 4080 Ti | 8 | 75%–100% | 80-90 FPS |
| Automobilista | NVIDIA RTX 4080 Super | 8.3 | 75%–100% | 70-80 FPS |
| Automobilista | NVIDIA RTX 4080 | 10 | 75%–100% | Above 90 FPS |
| Automobilista | NVIDIA RTX 4070 Ti Super | 8 | 75%–100% | 60-70 FPS |
| Automobilista | NVIDIA RTX 4070 Ti | 8 | 50%–75% | 80-90 FPS |
| Automobilista | NVIDIA RTX 4070 Super | 9 | 25%–50% | 40-50 FPS |
| Automobilista | NVIDIA RTX 4070 | 9 | 50%–75% | 60-70 FPS |
| Automobilista | AMD RX 7900 XTX | 7.5 | 75%–100% | 80-90 FPS |
| Automobilista | AMD RX 7900 XT | 8 | 75%–100% | 80-90 FPS |
| Automobilista | NVIDIA RTX 3090 | 8 | 50%–75% | 80-90 FPS |
| Automobilista | NVIDIA RTX 3080 Ti | 7 | 50%–75% | 60-70 FPS |
| Automobilista | NVIDIA RTX 3080 | 9 | 75%–100% | 70-80 FPS |
| Game | GPU | Score | Res Scale | Avg FPS |
|---|---|---|---|---|
| Automobilista | AMD 9950X3D | 10 | 75%–100% | Above 90 FPS |
| Automobilista | AMD 9800X3D | 8.6 | 50%–75% | 80-90 FPS |
| Automobilista | Intel i9-14900KF | 8 | 75%–100% | 70-80 FPS |
| Automobilista | Intel i9-14900K | 8 | 75%–100% | 40-50 FPS |
| Automobilista | Intel i5-14600K | 8 | 75%–100% | 80-90 FPS |
| Automobilista | Intel 285K | 6 | 10%–25% | 60-70 FPS |
| Automobilista | Intel i7-14700K | 8 | 75%–100% | 60-70 FPS |
| Automobilista | AMD 7950X3D | 8.7 | 75%–100% | 80-90 FPS |
| Automobilista | AMD 7900 | 10 | 75%–100% | Above 90 FPS |
| Automobilista | AMD 7800X3D | 8.2 | 75%–100% | 70-80 FPS |
| Automobilista | AMD 7600X | 7 | 75%–100% | 60-70 FPS |
| Automobilista | Intel i9-13900KS | 8 | 75%–100% | 70-80 FPS |
| Automobilista | Intel i9-13900 | 9 | 75%–100% | 70-80 FPS |
| Automobilista | Intel i7-13700K | 8.5 | 50%–75% | 80-90 FPS |
| Automobilista | Intel i7-13700 | 9 | 50%–75% | 80-90 FPS |
| Automobilista | Intel i5-13600K | 8.5 | 50%–75% | 60-70 FPS |
| Automobilista | Intel i5-13500 | 6 | 10%–25% | Above 90 FPS |
| Automobilista | AMD 5950x | 9 | 75%–100% | 60-70 FPS |
| Automobilista | AMD 5900X | 8.7 | 75%–100% | 80-90 FPS |
| Automobilista | AMD 5800X3D | 8.3 | 75%–100% | 70-80 FPS |
| Automobilista | Intel i9-12900K | 9 | 75%–100% | 70-80 FPS |
| Automobilista | Intel i9-11900K | 10 | 75%–100% | 80-90 FPS |
| Automobilista | Intel i9-10900K | 10 | 50%–75% | Above 90 FPS |
| Automobilista | Intel i7-12700K | 10 | 50%–75% | 80-90 FPS |
| Automobilista | Intel i5-11600K | 8 | 75%–100% | 70-80 FPS |
Euro Truck Simulator / American Truck Simulator

| Game | GPU | Score | Res Scale | Avg FPS |
|---|---|---|---|---|
| Truck Simulator Series | NVIDIA RTX 5080 | 8.0 | 75%–100% | 70-80 FPS |
| Truck Simulator Series | NVIDIA RTX 5070 Ti | 9.0 | 10%–25% | 80-90 FPS |
| Truck Simulator Series | NVIDIA RTX 5060 Ti | 9.0 | 50%–75% | 50-60 FPS |
| Truck Simulator Series | NVIDIA RTX 4090 | 8.4 | 75%–100% | 60-70 FPS |
| Truck Simulator Series | NVIDIA RTX 4080 Ti | 8.0 | 75%–100% | 80-90 FPS |
| Truck Simulator Series | NVIDIA RTX 4080 Super | 7.0 | 75%–100% | 60-70 FPS |
| Truck Simulator Series | NVIDIA RTX 4070 Ti | 10.0 | 75%–100% | 80-90 FPS |
| Truck Simulator Series | NVIDIA RTX 4070 Super | 9.0 | 25%–50% | 40-50 FPS |
| Truck Simulator Series | NVIDIA RTX 4070 | 9.0 | 50%–75% | 40-50 FPS |
| Truck Simulator Series | AMD RX 7900 XTX | 8.0 | 75%–100% | 70-80 FPS |
| Truck Simulator Series | AMD RX 7800 XT | 9.0 | 75%–100% | 50-60 FPS |
| Truck Simulator Series | NVIDIA RTX 3090 | 9.0 | 75%–100% | 70-80 FPS |
| Truck Simulator Series | NVIDIA RTX 3080 | 10.0 | 50%–75% | 80-90 FPS |
| Truck Simulator Series | NVIDIA RTX 3060 Ti | 9.0 | 75%–100% | 40-50 FPS |
| Game | CPU | Score | Res Scale | Avg FPS |
|---|---|---|---|---|
| Truck Simulator Series | AMD 9800X3D | 9.0 | 75%–100% | 60-70 FPS |
| Truck Simulator Series | Intel i9-14900KF | 8.0 | 75%–100% | 70-80 FPS |
| Truck Simulator Series | Intel i9-14900K | 6.5 | 75%–100% | 30-40 FPS |
| Truck Simulator Series | Intel i9-14900 | 9.0 | 75%–100% | 40-50 FPS |
| Truck Simulator Series | AMD 7950X3D | 10.0 | 75%–100% | 40-50 FPS |
| Truck Simulator Series | AMD 7800X3D | 8.0 | 50%–75% | 80-90 FPS |
| Truck Simulator Series | AMD 7700 | 9.0 | 75%–100% | 40-50 FPS |
| Truck Simulator Series | AMD 7700K | 9.0 | 75%–100% | 50-60 FPS |
| Truck Simulator Series | Intel i9-13900KS | 8.0 | 50%–75% | Above 90 FPS |
| Truck Simulator Series | Intel i9-13900 | 8.0 | 75%–100% | 50-60 FPS |
| Truck Simulator Series | Intel i5-13600K | 9.0 | 50%–75% | 40-50 FPS |
| Truck Simulator Series | AMD 5800X3D | 9.0 | 75%–100% | 80-90 FPS |
| Truck Simulator Series | AMD 5900X | 8.7 | 75%–100% | 80-90 FPS |
| Truck Simulator Series | Intel i9-9900K | 9.0 | 50%–75% | 50-60 FPS |
| Truck Simulator Series | Intel i5-11600K | 8.0 | 75%–100% | 70-80 FPS |
GPU & CPU Requirements Summary
GPU Requirements:
High-End (RTX 4080 / 7900XTX level): Racing/simulation games can reach 80–90 FPS at high resolution settings.
Mid-Range (RTX 3080 / 4070 level): Racing games can achieve 60–70 FPS at medium graphics settings; flight simulators can reach 50–60 FPS at high resolution.
Entry-Level (RTX 2080 / 3060Ti level): Still playable by balancing graphics quality and performance.
CPU Requirements:
High-End (7800X3D / 14900K level): Demanding flight simulators can achieve 50–70 FPS at high graphics settings; other games can run at over 70 FPS on maximum settings.
Mid-Range (5800X3D / 13600K level): Flight simulators can run at 40–60 FPS with high graphics settings; other games can still exceed 60 FPS on maximum settings.
Entry-Level (5600X / 11600K level): Capable of running racing simulators smoothly at medium graphics settings; flight simulators can be played with reduced graphics settings.
Find the Best Match Between Your PC Setup and Pimax Crystal Light Performance
This user-sourced performance database is designed to help you determine the compatibility and expected VR quality when using the Pimax Crystal Light with your current PC hardware. As new data comes in, we will continue to update this page to reflect the latest real-world usage across various GPUs, CPUs, and VR games.
If you're searching for:
“Will Pimax Crystal Light run well on my PC?”
“Crystal Light FPS with RTX 3070 and DCS World”
“Best GPU for Pimax Crystal Light”
— then you've come to the right place.
Bookmark this page and check back regularly for the most up-to-date Crystal Light performance insights straight from the Pimax community.

- Choosing a selection results in a full page refresh.